This is a rough note/log with the results of a research mini-project I'm in the middle of. I'm investigating how the differing incentives of SAEs and Parameter Decomposition lead to aligned vs. misaligned features. There are some interesting graphs to look at, but I'm not at all confident in my interpretations yet!
Stochastic Parameter Decomposition (SPD) is a relatively new method to reverse engineer neural networks. It's based on the belief that NNs can be partitioned a set of loosely independent mechanisms of which only a subset are important for any particular input. The basic idea is to decompose the weight matrices of the NN into a sum of $k$ rank-1 matrices, a.k.a. subcomponents, such that we can mask out these subcomponents as much as possible for any particular input.
This is somewhat similar to the sparsity constraint used to train SAEs, but differs from SAEs in a few important ways:
- The subcomponents are strongly incentivized to sum to the target model's weight matrix via a faithfulness loss
- Instead of aiming for sparsity for reconstruction of activations within a particular layer, SPD aims for minimal Causal Importance (CI) to the network's final output. Notably, this is global rather than local, and the minimization of the causal importance is aiming for a general minimum norm as opposed to maximizing the number of $0$ CIs (footnote 4 of the SPD paper gives their thinking for why $p>1$ works).
SPD is partially a response to the conceptual and empirical limitations of SAEs, such as
- their failure to find a atomic and complete descriptions of features
- their ignorance of feature geometry
- the significant reconstruction error that doesn't seem to be going away
It seems worthwhile to investigate how the differing incentives of SAEs v. SPD lead to different partitions of a model. At the very least, I'd like a better intuition here. More ambitiously, an understanding of this may be useful in answering the questions of whether SAEs and SPD can be complementary, and whether we expect SPD to suffer from any of the same failure modes.
Investigation
While the SPD paper only applied the decomposition to toy models, they've since run the decomposition on some larger (but still relatively small) language models, of which the pretraining and decomposition runs are public.
I chose a decomposition of a small Llama model trained on Simple Stories with the following architecture:
- 192d residual stream
- 786d GELU MLP
- 2 layers
I trained top-k SAEs on the outputs of both MLP's down projections into the residual stream, and have mainly been comparing the resulting SAE latents with the SPD vectors from the decomposition of the down projection.1
We can compute the cosine similarity (as a proxy for alignment) of each SPD vector2 with each SAE latent and take the max (comparing to the max cosine similarities you would see if you uniformly sample unit vectors of the same dimension):

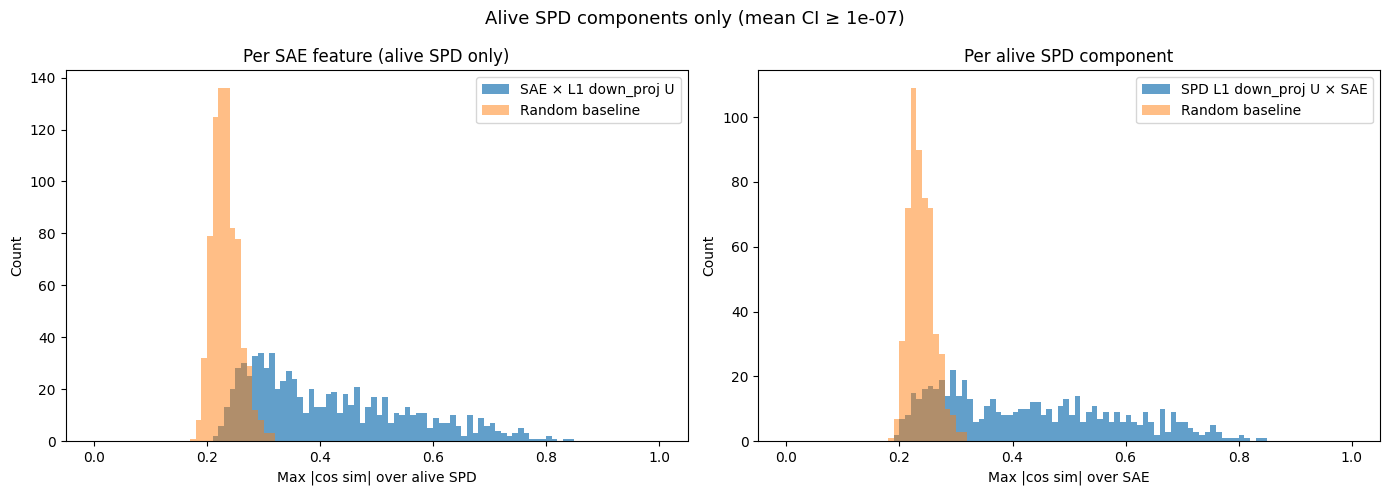
- What I notice
- There is a lot more alignment than we would expect by chance, suggesting the two methods are converging to similar features, at least some of the time
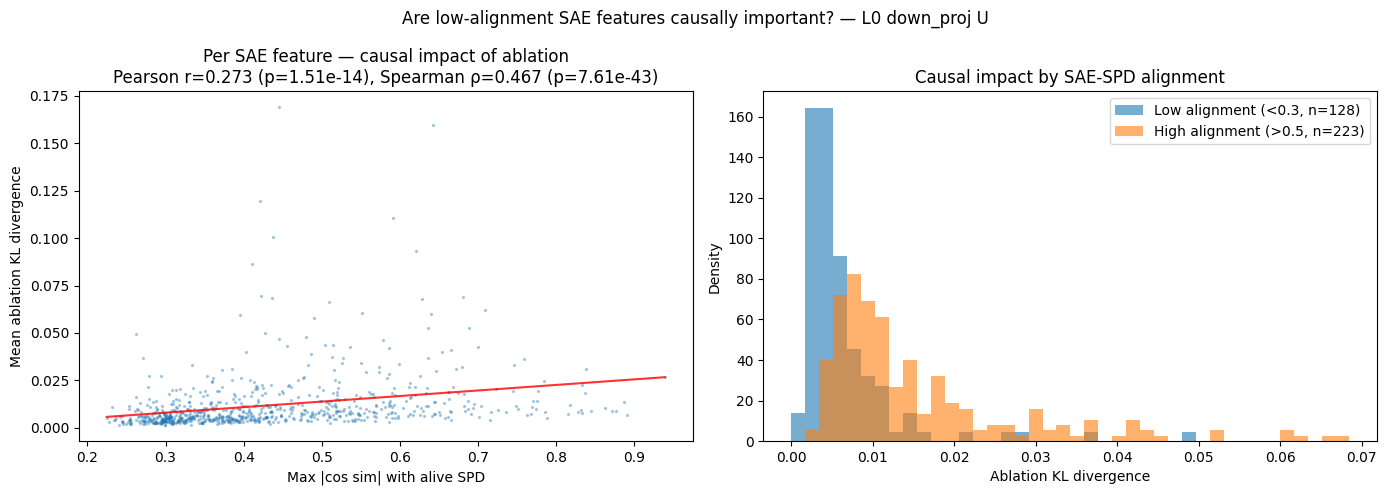
We can also see how the max cosine similarity varies with the mean CI:
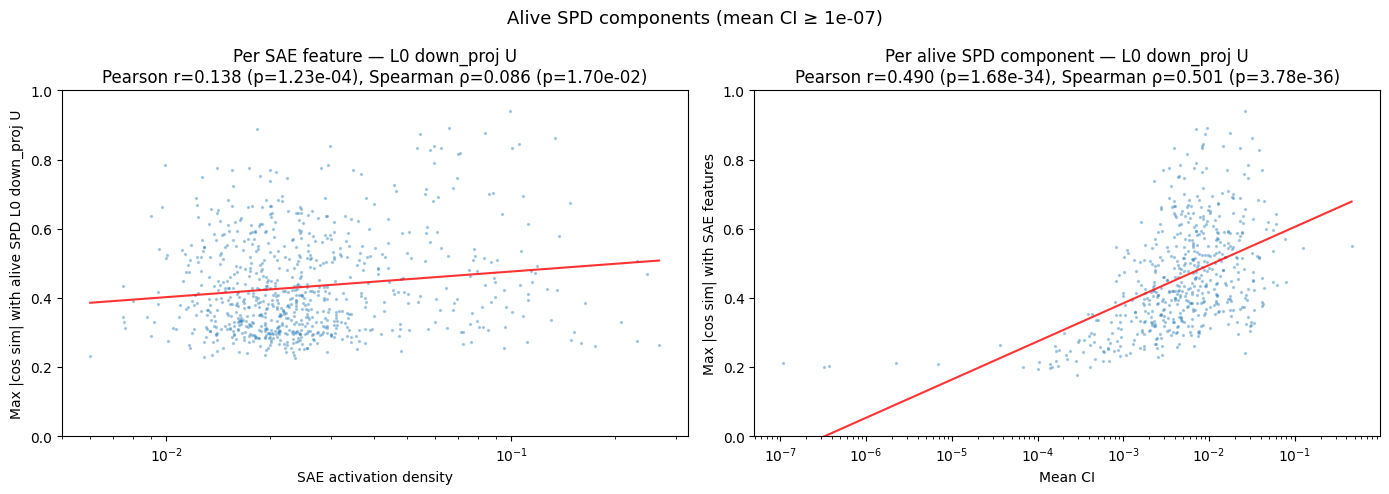
- What I notice
- There is a decently strong correlation between mean CI and max cosine similarity. Mean CI increasing by an order of magnitude translates to roughly $+0.15$ max cosine similarity (and this is understated because of outliers on the left). This implies that subcomponents that SPD uses more often to explain model outputs are significantly more likely to be aligned with an SAE latent.
- Interestingly, the converse is much weaker.
We can also look at how max cosine similarity varies with the entropy of a subcomponent's CI. A subcomponent might be causally important in an all-or-nothing way (low entropy), or might be causally important to often differing amounts (high entropy); does this vary with SAE alignment?
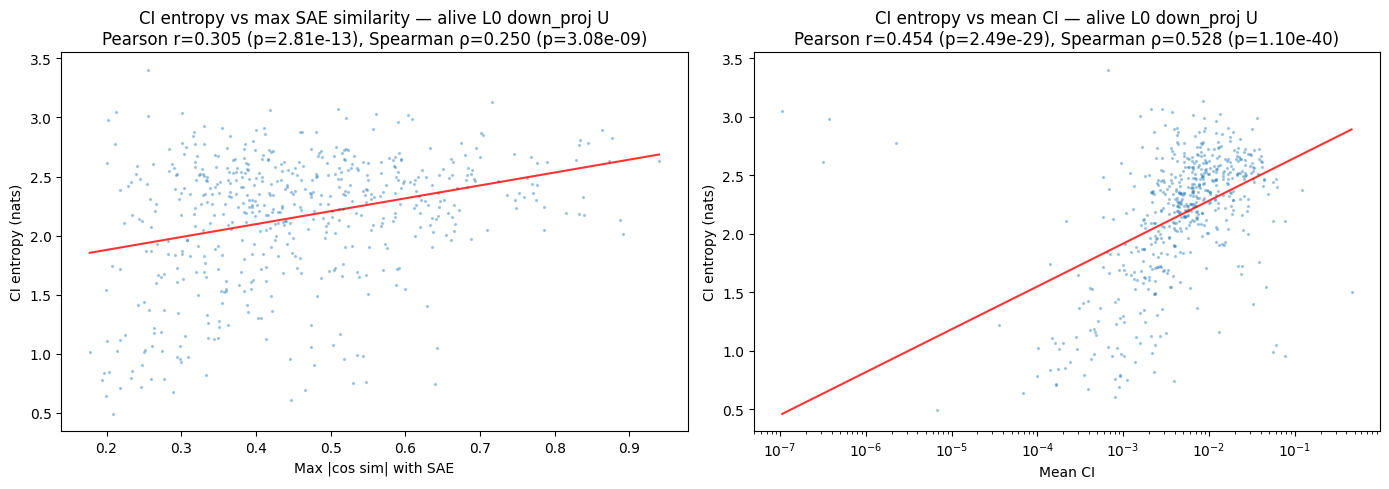
- What I notice
- Correlation between CI entropy and max cosine similarity, though there's a strong correlation between CI entropy and mean CI, which is probably the culprit.
Another thing we can do is try interpreting some individual SPD/SAE vectors/latents with differing alignments. As a first attempt, I binned alignments into low (0.0-0.15), mid (0.15-0.5), and high (0.4+) max cosine similarity and sampled pairs from each bin to interpret. Here are my high-level takeaways from staring at these for a bit:
- higher cosine similarity loosely correlates to higher semantic alignment
- low alignment latents / vectors are still often interpretable, loosely ruling out a potential hypothesis that low alignment latents / vectors are finding garbage.
I think there's a lot more interesting analyses that could be done here, ex. using word embeddings or LLMs to classify/quantify different dimensions of each feature 3 and investigating whether the misaligned SAE/SPD latents/vectors are finding obvious distinct classes of features. But I haven't done this yet!
At this point, it seems clear that there is a fair amount of overlap in the feature spaces found by SAE v. SPD, but they also spend a lot of capacity representing different things (and the bits that differ are actually used), but it's unclear how/why they differ. Some possible explanations:
- SPD "wants" to capture the same features as an SAE, but the constraint that each subcomponent must sum to $W$ causes it to learn slightly rotated features.
- The misaligned SAE latents aren't causally important, but are statistically salient in the activation space (and hence represented by the SAEs).
- The misaligned SAE features are computed via higher-rank components, which SPD either doesn't capture or captures via the sum of multiple rank-1 subcomponents.
Out of these, I'm most leaning towards (3), but there're probably other explanations to be found as well.
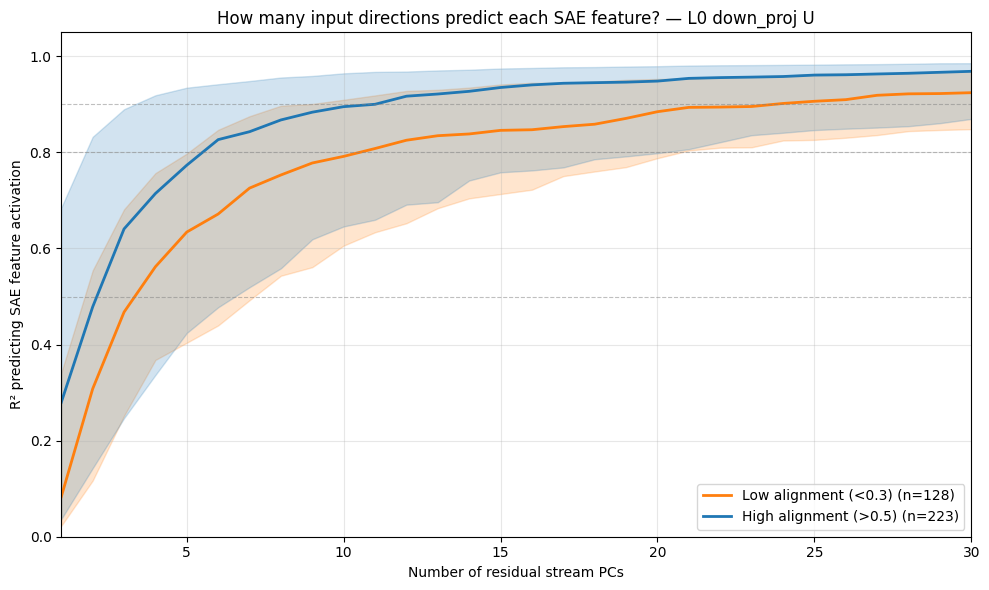
If SPD learns a slightly rotated version of the SAE feature space, we would expect to be able to reconstruct most SAE latents with a linear combination of just a few SPD vectors. We can test this by performing orthogonal matching pursuit to see how few SPD vectors we need to reconstruct each SAE latents, and then plot the cosine similarity we achieve with with each component added:
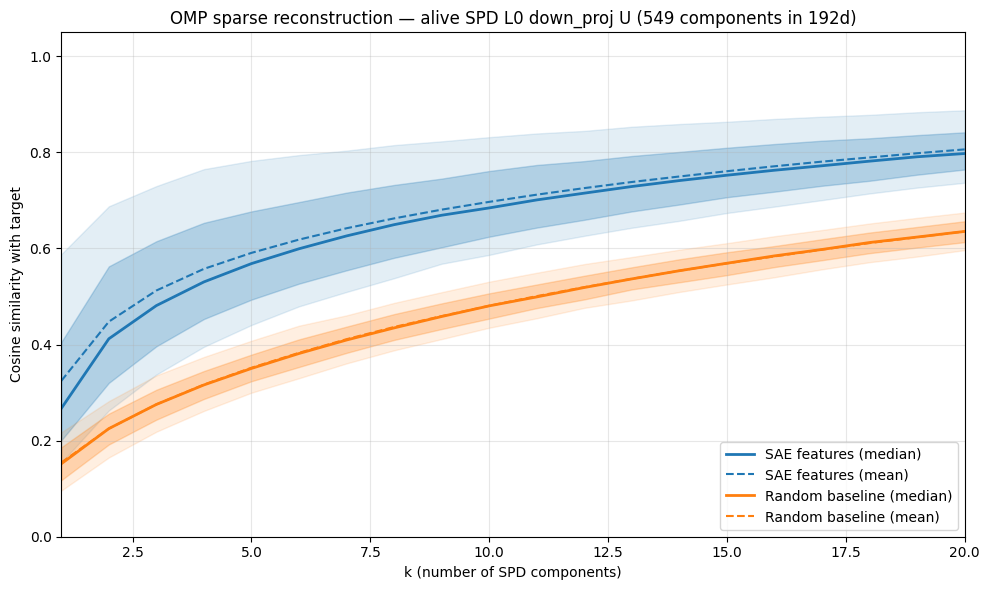
- Each additional SPD vector past the most aligned one ($k=1$) doesn't help that much (increases barely faster than random) to reconstruct the SAE latent. So this seems like a negative result for the first hypothesis that SPD learns a slightly rotated version of the SAE basis.

each rank-1 subcomponent is $uv^\text{T}$, which we can view as reading in from the $v$ direction and writing out to the $u$ direction, $(uv^\text{T})x=u(v^\text{T}x)$. So I'm taking all the $u$ vectors from the subcomponents in the down projections as they're responsible for the MLP writing into the residual stream.
Note that I'm filtering out the SPD vectors that have a very low mean Causal Importance , a.k.a. the "dead" SPD vectors. They're concentrated in a clump of max cosine similarity around/just below the random baseline.
how high level is it? How easy is it to interpret (more rigorously)? What types of things are being represented?